Using stats while in a match can be a tricky thing. Everyone has personal preferences as to what they want to see in the heat of the moment. Most coaches want the full box score and rotational stats after the match, but they are of little value (for the most part) during the progress of a match. Some coaches want to know what their passer rating is. Others want to know what there serving ratio is. Personally, I could care less about most stats in match. Most coaches know when their team is on or off at a specific skill. I just need an overall feel for the game, and not to be overloaded with numbers and percentages. In fact, an overload of stats (during and after a match) can be a bad thing. If you fail to get the whole picture around the stats, you could make changes and tweaks that do not need to be made. A few years ago when I was in the first BCAP class offered by USA Volleyball, one of the modules was “Stats for the Beach Game” and it was hosted by Jon Aharoni. The concept was based on a trend line and was a pretty simple concept. That is when it hit me. If I could modify this concept for indoor, I could use this as a coach and not have my face buried in stats during a match. The challenge was that unlike indoor, beach volleyball has a lot fewer data going into the stats. There are fewer players and less actions (please note, I did not say less action..I said less actions). I began to tinker and for the last 2 years (one high school season and one college season) I have begun to perfect my system. There is a reason why I say “My System”. The one thing I like most about the trend line method is that you can make it what you want. It really is like starting with a blank map. The example(s) I am going to post here are pretty simple, yet functional. I have actually switched my volleyball folder over to graph paper as opposed to standard lined paper. I have found using graph paper keeps the trend line cleaner, but you can use regular paper in a pinch. I also do each set on a single piece of paper. That way you do not have to cram things in at the end. I am actually developing an application for the iPad that will do the trend lining and save each set. For the example below, I have recreated a trend line for a 15 point set. I used Excel to create it, but a pencil and paper work just as good.
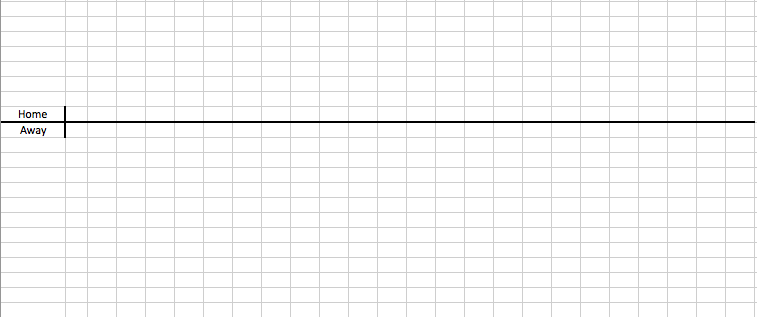
First, you need to set up your trend line with a Home/Away or Team Name/Team Name line.
Now that you are set up, you can begin to stat. There are basically two actions you have to do. You either mark the point for your team by making an “upside down L” or you give your opponent a point by making a regular “L”. If you are using graph paper (or excel) you will do a left vertical line with a connected top horizontal line for a home point and left vertical line with a connected bottom horizontal line. You will do this every point. The key is the more points a team score, the more “steps” it will make. If points are traded back and forth, it will make a “cog” look on the trend line.
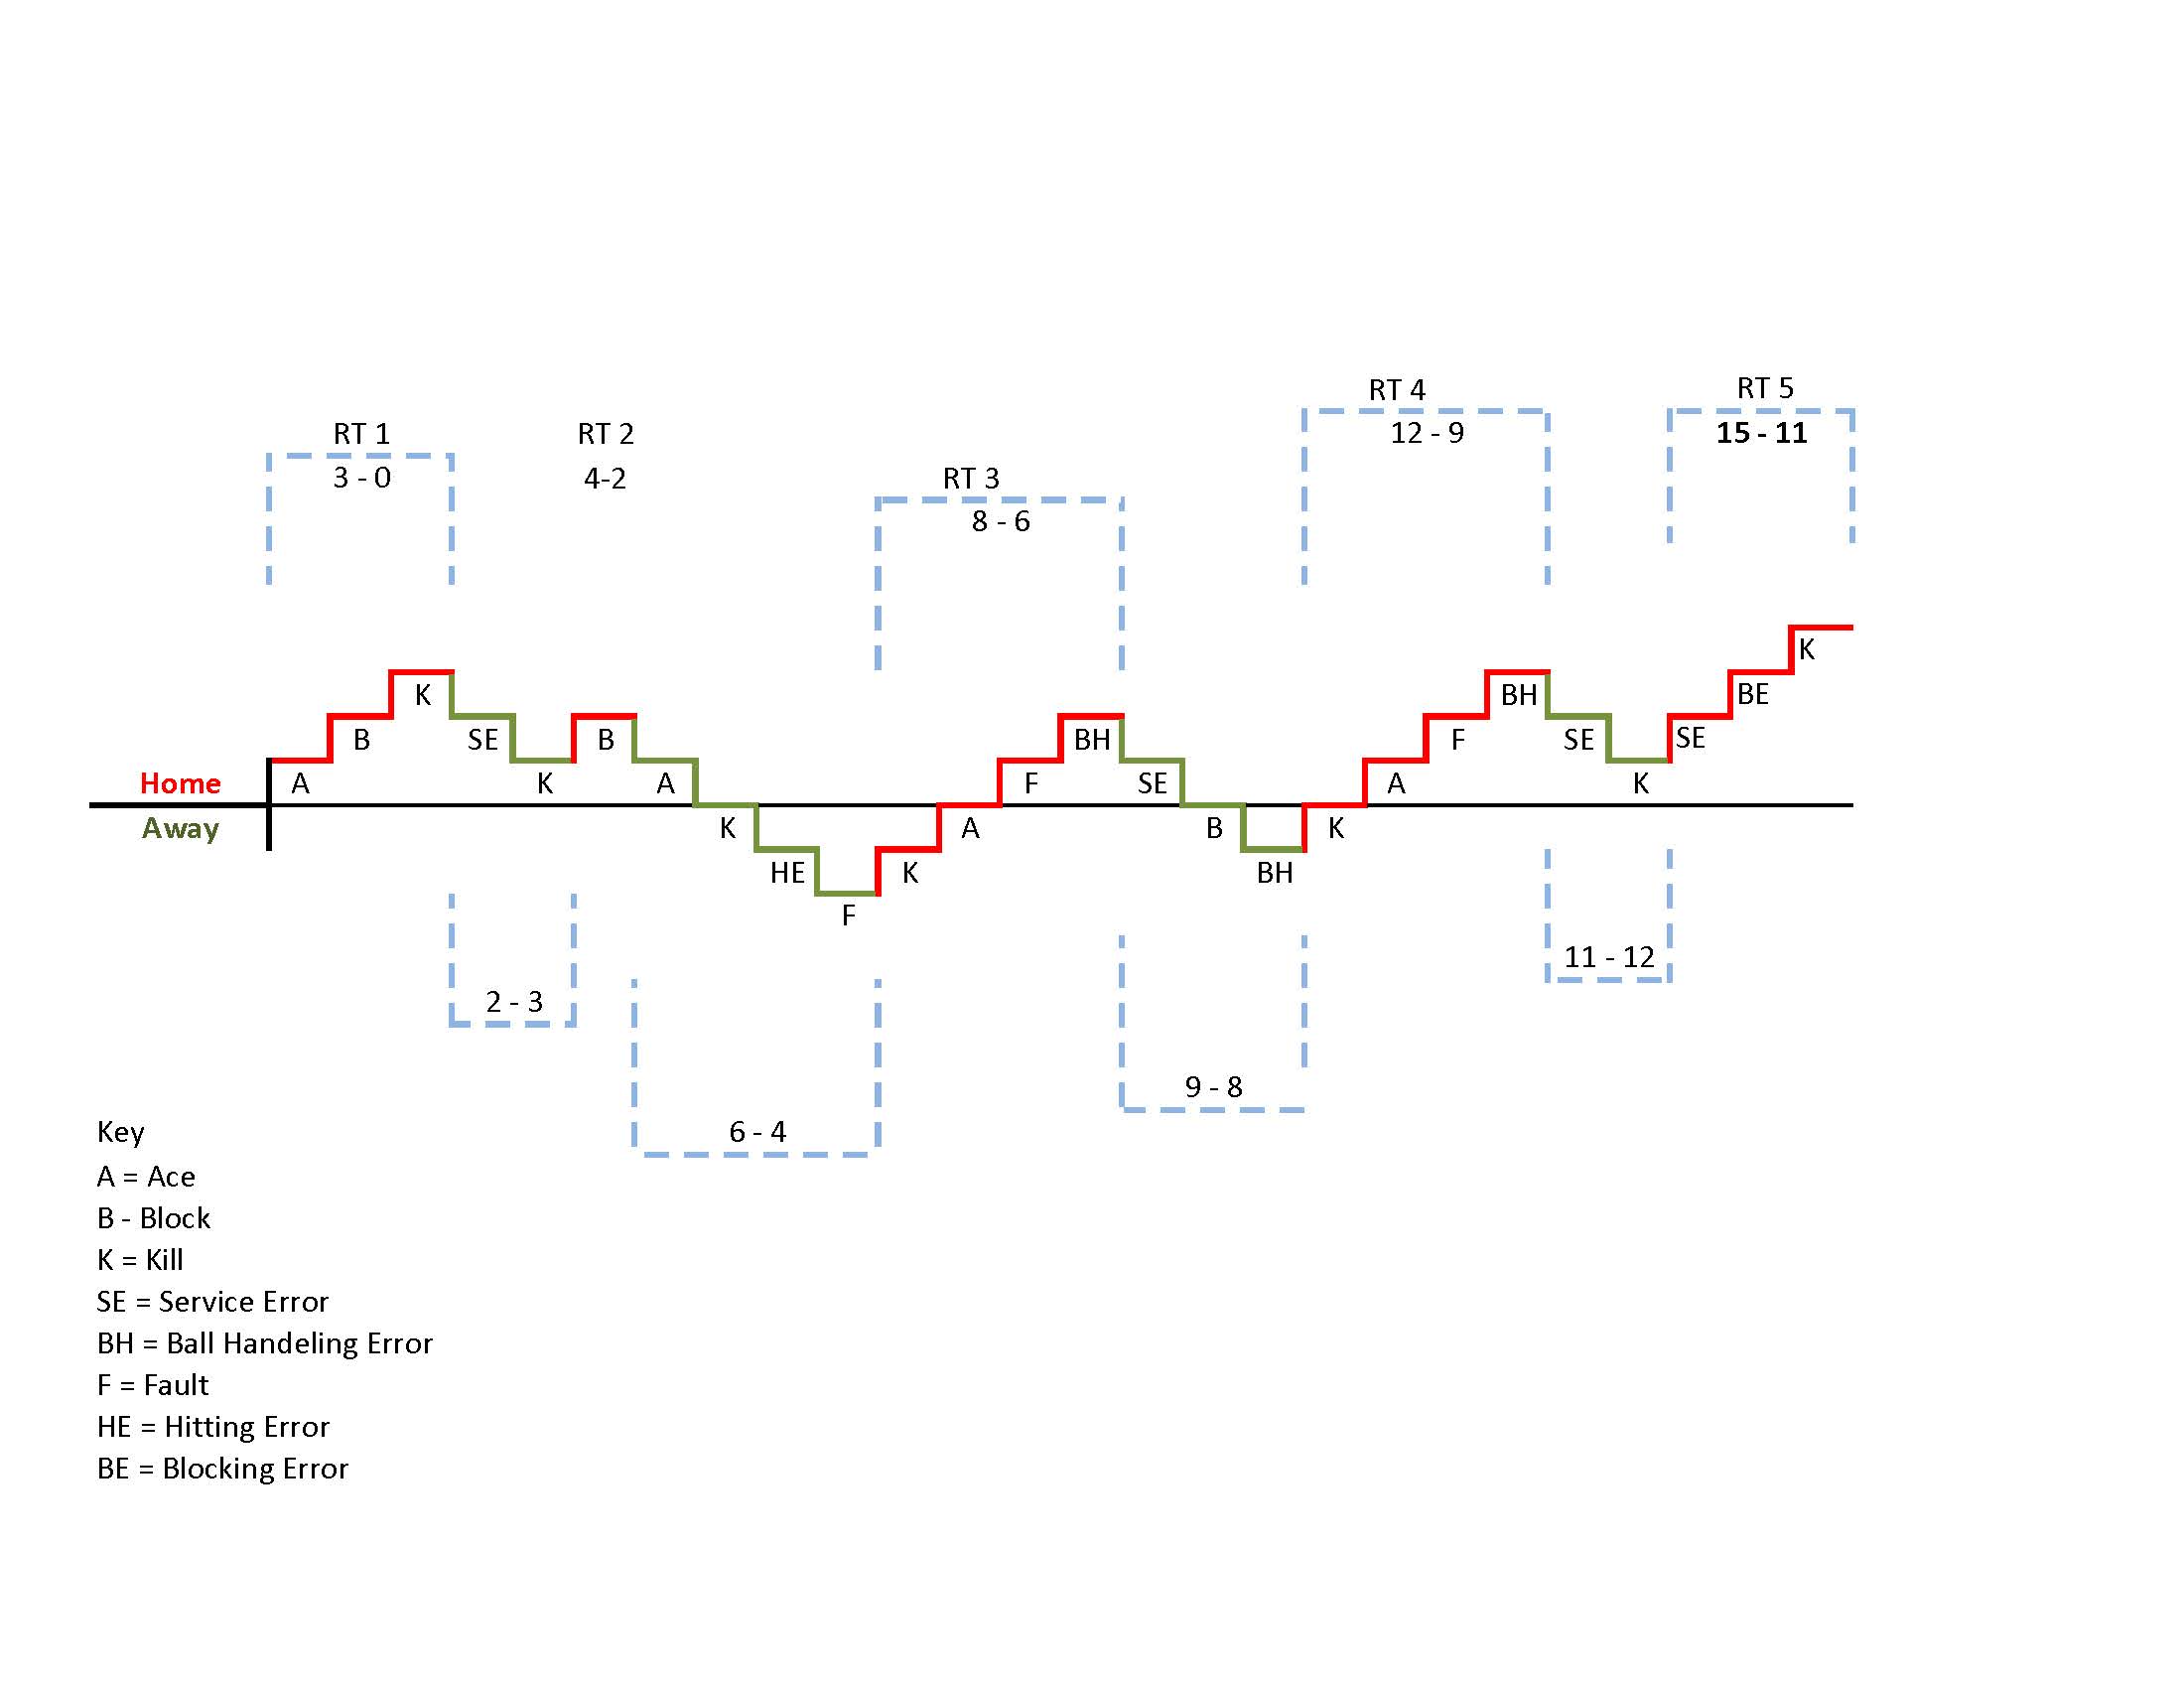
Inside the steps is where you can get creative. I personally write the action that creates the point in the step for home point and below the step for away points. You can also get creative using different pen colors for the teams. Here is the example of the 15 point set that my team won. I will explain some of the items on the trend line.
- I did all the home points and red and all the away points in green
- The key is at the bottom. I put the action that caused the point in the step (home) or below the step (away)
- The blue dashed lines show point runs. I put the serving team score first, but you can put your score first every time.
- I put the rotation # above our score run, so I know where we are in rotation.
I won’t go over the entire game, but you can see we started out the set with a 3-0 run (Ace, Block, Kill). We then had a service error and the opposing team had a kill to bring the set to 3-2. The rest should be self explanatory. As you see the line get closer to the trend line, you know that the score is close. It is a quick way to take the emotion out of a game. A kill may seem huge in a game, but when you look at the trendline, you can see that you were still running away with the match. There would be no need to overact.
The key to a trundling is that it is all about giving you a feel. You can look down and see the “mood” of your play. Often times with timeouts, stoppages in play, subs, etc., coaches forget about how long a point streak has been going on. Saying you are on a 5 point skid is not as bad as seeing it in graphic form. I suggest you keep it simple at first. This is NOT a system to replace your actual stat systems. Keep that in mind.
I just wanted to post an introduction on the topic, because not too many people use this method. As a head coach, I found it great. It gave me something to do to calm down during a game, yet still be able to coach. I have had assistants who would put where we served to in the trendline to see if we had runs against certain players. You can customize your trendline as much as you like. One other side effect is the visual of the trendline during a time out. There have been times where a team went on a huge run. While the score may seem close, I just hold up the trendline and the players instantly see that we are giving it away.
I hope this post at least opens you up to trying something new. Who knows what use you may have with a trendline.
UPDATE: I have added a sheet, instructions, and sample in the download section of the website.
5 comments for “Trend Line Stats: Think Outside the Stat Box”